We bought two Google Ads campaigns this year. Both delivered traffic. Neither delivered a single lead.
This is what the reporting told us, what our own server log told us instead, and why the two did not agree. If you are a small manufacturer considering paid search, our experience may save you the money we spent finding this out.
CAMPAIGN ONE: THE WHOLE CATALOG
The first campaign advertised Seyunda broadly — the full portfolio, springs and wire forms, clips and clamps, SMD and EMI contacts, and the CNC machinery line. The idea was straightforward: put the whole capability in front of anyone searching for any part of it.
Traffic arrived. Visitor numbers rose, the dashboard showed pages being viewed, and the campaign looked like it was working.
No inquiries came. Not a reduced number. None.
CAMPAIGN TWO: THE SPRING CONTACT PROMOTION
We assumed the first campaign had been too general. A buyer searching for a specific component would not respond to a broad company advertisement, so we built a focused promotion page for SMD and EMI spring contacts and pointed a second campaign at it.
The response was immediate and much larger. Traffic jumped sharply within a day, and it kept coming for as long as the campaign ran. By every figure in front of us, this was working considerably better than the first attempt.
Again, no leads. Not one message through the form, not one email traceable to the campaign.
WHAT THE ADVERTISING REPORTS SHOWED
The reporting looked healthy, which is what made the situation confusing rather than obviously wrong.
- Visitors from many countries, which read like broad international reach for an exporter.
- Multiple pages viewed, suggesting people were moving through the site rather than bouncing.
- Click volumes that rose when we expected them to, responding to the campaign exactly as a working campaign should.
Nothing in that picture explained an inquiry count of zero. A campaign delivering genuinely interested engineers should produce something, even at a poor conversion rate.
So the numbers and the outcome disagreed, and we had no way to tell which one was wrong.
WE WENT TO THE SERVER INSTEAD
Hostinger keeps a raw access log: every request made to the site, with the time, the country, the device, and the number of bytes sent. It is not a summary and it is not produced by anyone with an interest in the result. It is simply a record of what happened.
We downloaded seven days of it — around 30,000 requests — and used Claude AI to reconstruct what each visitor actually did, session by session.
The picture changed completely.
WHAT THE LOG ACTUALLY SHOWED
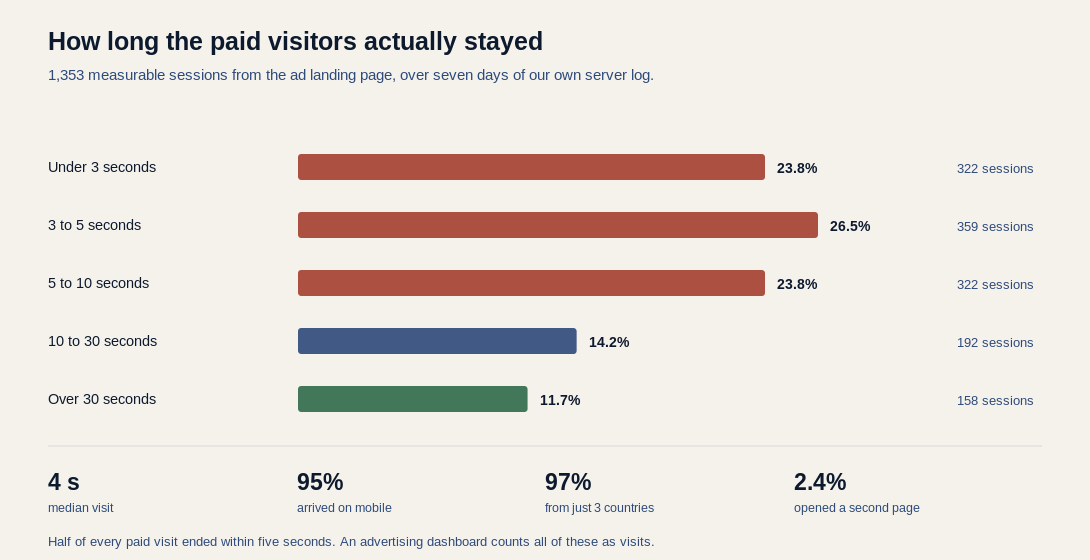
- The median visit lasted four seconds. Half of all paid sessions ended within five seconds, and a quarter within three. Three quarters were gone inside ten.
- Ninety-five percent arrived on a mobile phone. Almost nobody came on a desktop, which is not how engineers evaluate a component supplier.
- Ninety-seven percent came from three countries, concentrated in a region that has never generated business for us.
- Two point four percent opened a second page. Of 1,415 visitors, thirty-four looked at anything beyond where they landed.
There was one more finding worth naming. Fifty-three visitors requested our datasheet, which initially looked like the one encouraging signal in the data. Then we checked the timing: half requested it within ten seconds of arriving, faster than the page finishes loading. It was not interest in the document. It was a button being touched on the way past.
WHY THE TWO PICTURES DISAGREE
Neither source was lying. They measure different things, and the difference matters.
An advertising platform counts clicks. Its job ends the moment the browser requests your page. Everything after that — whether anyone read anything, how long they stayed, whether they were a person evaluating a supplier — is outside what it can observe.
The server log records the rest. It cannot tell you why someone came, but it records precisely what they did once they arrived, and it has no reason to present it favorably.
Put simply: the clicks were real, and the visits were not. Both statements are true at once, and only one of them appears in a campaign report.
WHAT WE WOULD DO DIFFERENTLY
- Read the server log before judging any campaign. Not the dashboard, and not an analytics summary. The raw record.
- Measure time on page, not clicks. A four-second median tells you more than any impression count.
- Check the device mix. For industrial components, a 95 percent mobile audience is a warning rather than a reach statistic.
- Check where visitors actually are, against where your customers actually are.
- Distrust a conversion that happens too fast. A download requested within ten seconds of landing is a touch, not an intention.
THE WIDER POINT
The same log contained something we had not gone looking for. Around 129 visitors reached the site with no advertisement involved at all — most of them in the United States and Brazil — and those people opened coiler pages, grinder specifications, and individual contact types. Several stayed more than an hour.
Nothing was counting them, because no campaign had delivered them. They were the closest thing to real buying interest in the entire week, and they were invisible in the reporting we were reviewing.
If you are spending on paid search, download your own access log and look at it directly. It is free, it is already being collected, and it answers a question no advertising report is built to answer: not how many people clicked, but whether anybody actually read anything.
Send us your board layout, shielding requirements, or contact specifications and our engineering team — backed by 20+ years of spring and electronic contact manufacturing — will get back to you with a competitive quote and realistic turnaround.
Email: sales@seyunda.com
Phone: +65 9168 2618
We look forward to supporting your next PCB program.
Published by the Seyunda Team · 2026